
This census map shows that the majority of the African American population lives in the South East continental US. They live more inland than in along the coast. Also there is a significant scatter around the general eastern half of the country and by the South West- California, Arizona area. This makes sense, since historically these are the areas Blacks were originally brought during the 1700 -1800s.
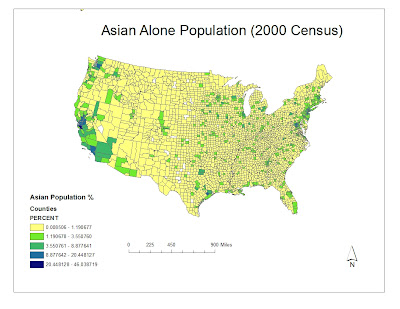
This map shows the Asian population in the continental US. It shows that Asian populations are predominately in the West Coast of the nation. This makes sense because the West Coast is on the other side of the Pacific Ocean, so logistically, this area was the most feasible. There are very few amounts spread through out the Midwest as well as in the South, except for the larger cities. There is also a decent population in the East coast- New England area. There are also pockets along Florida.
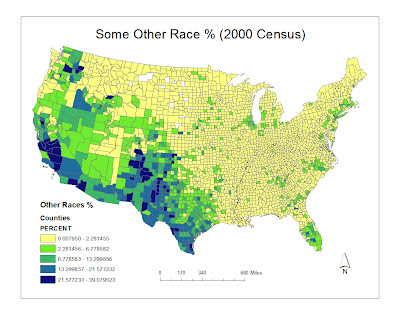
The Some Other Race population mostly lives in the West and South West areas of the nation. High populations live along the Mexico-America border. This can lead to the assumption that it is most likely a Hispanic population being shown. There is also a significant population in the southern tip of Florida as well as some scattered areas in the East Coast. The rest of the nation is mostly unpopulated by the Some Other Race, according to the 2000 Census.
Overall, ARC GIS has made data much more understandable. Before it was all in an excel sheet, which was hard to understand and imagine. Mapping it out, shows where the populations are mostly located in a viewer-friendly manner. The different options of shading effects also makes the information more digestible. ArcGIS is has also been helpful, because in one program I was able to convert file formats into graphable and map-able data. This was very helpful, because otherwise I would have to manually add all the information which would have been very time consuming and unproductive.
Overall, ARC GIS has made data much more understandable. Before it was all in an excel sheet, which was hard to understand and imagine. Mapping it out, shows where the populations are mostly located in a viewer-friendly manner. The different options of shading effects also makes the information more digestible. ArcGIS is has also been helpful, because in one program I was able to convert file formats into graphable and map-able data. This was very helpful, because otherwise I would have to manually add all the information which would have been very time consuming and unproductive.
No comments:
Post a Comment